
Up Down Trading Indicator (Free Download)
Discover the power of the Up-Down Trading Indicator: a reliable tool for accurate market signals across all currency pairs and time frames.
Unlocking the Power of the Up-Down Trading Indicator
If you’re looking for a reliable trading tool that works across all currency pairs and on various time frames, the Up-Down Trading Indicator might be just what you need. This indicator does not repaint, making it highly dependable for traders. It’s versatile, suitable for even the 1-minute charts, and designed to signal key market movements with accuracy.
Key Features of the Up-Down Trading Indicator
- Non-repainting: Ensures consistent reliability across trades.
- Versatile: Works on all currency pairs and time frames below the weekly chart.
- Minimal Signals: Provides clear and fewer signals to avoid noise.
- Adjustable Sensitivity: Customizable with the ‘C’ value for different trading pairs and periods.
- Mathematical Approach: Uses a systematic method to determine market direction.
How the Up-Down Trading Indicator Works
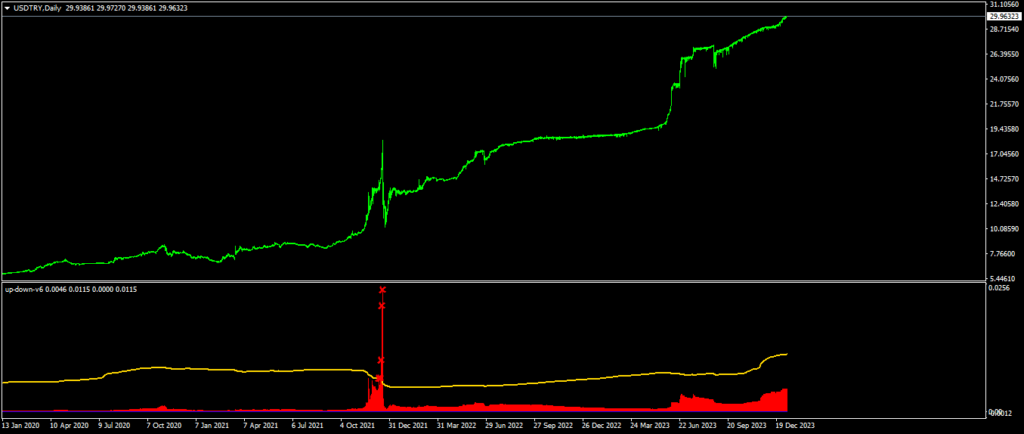
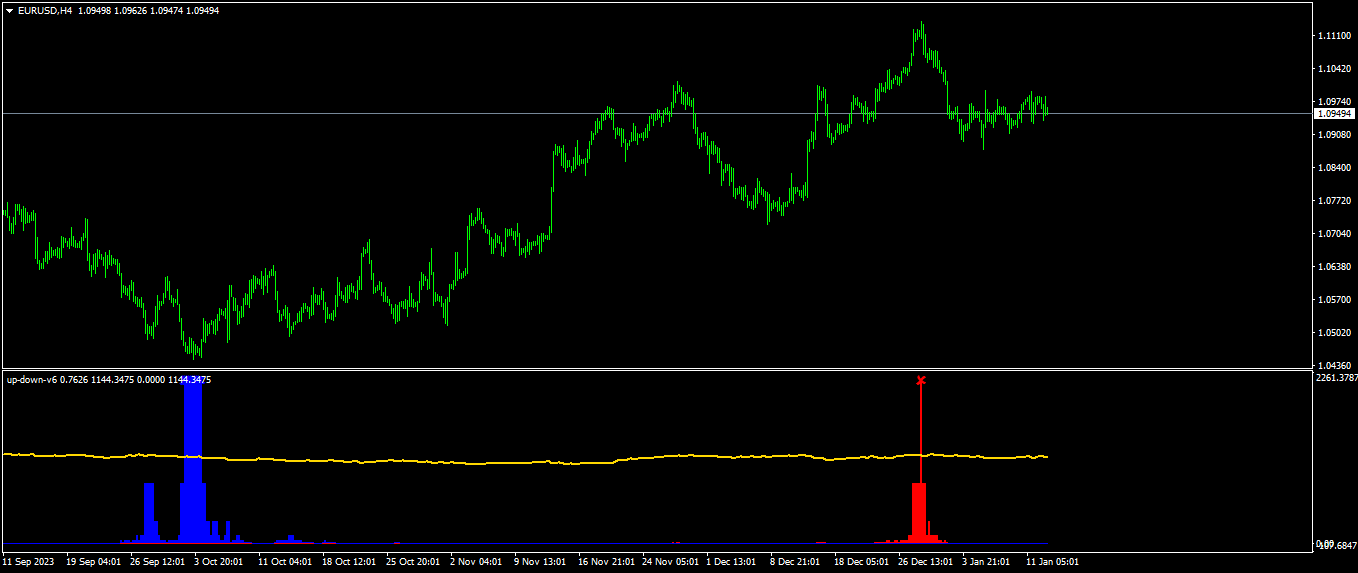
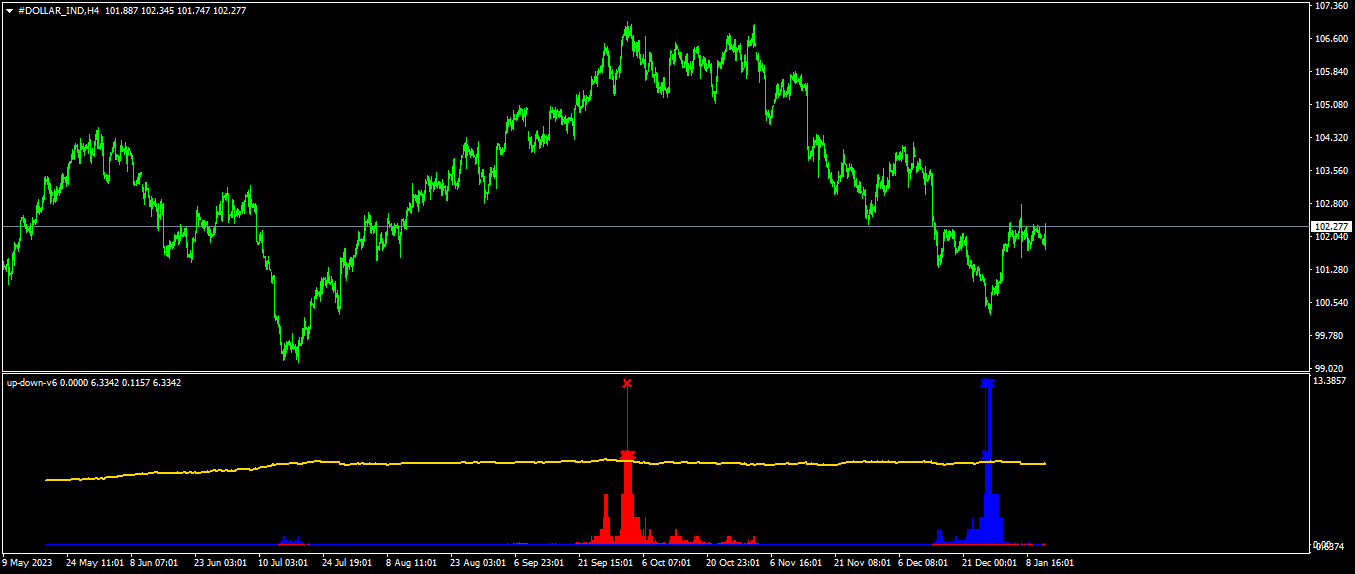
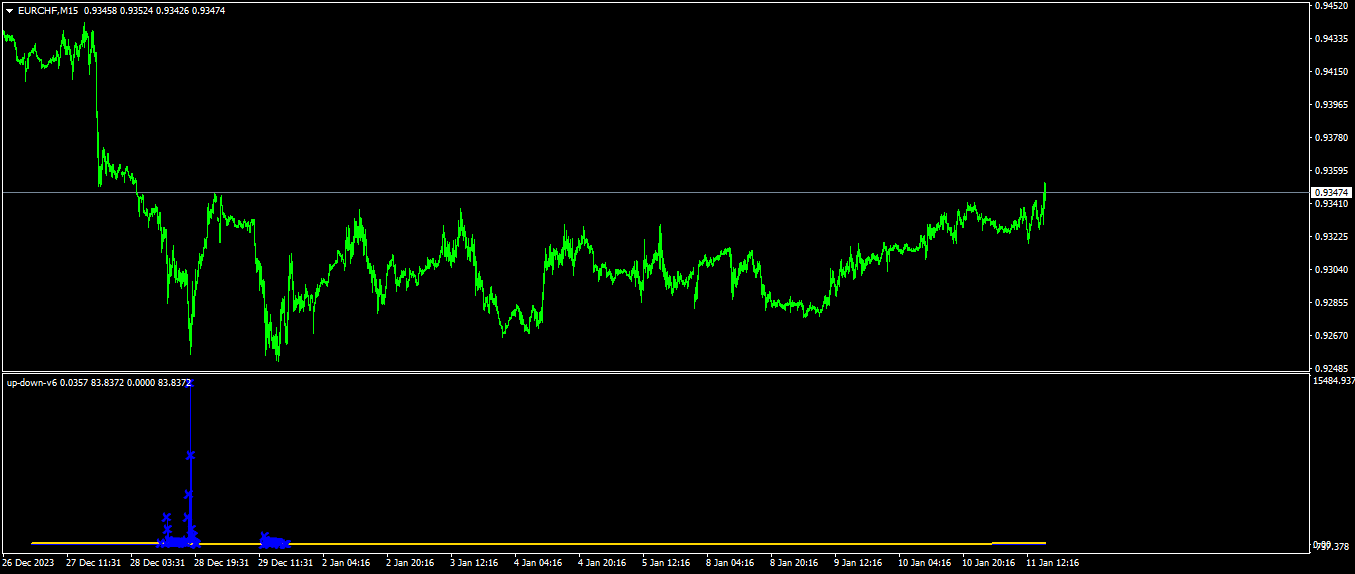
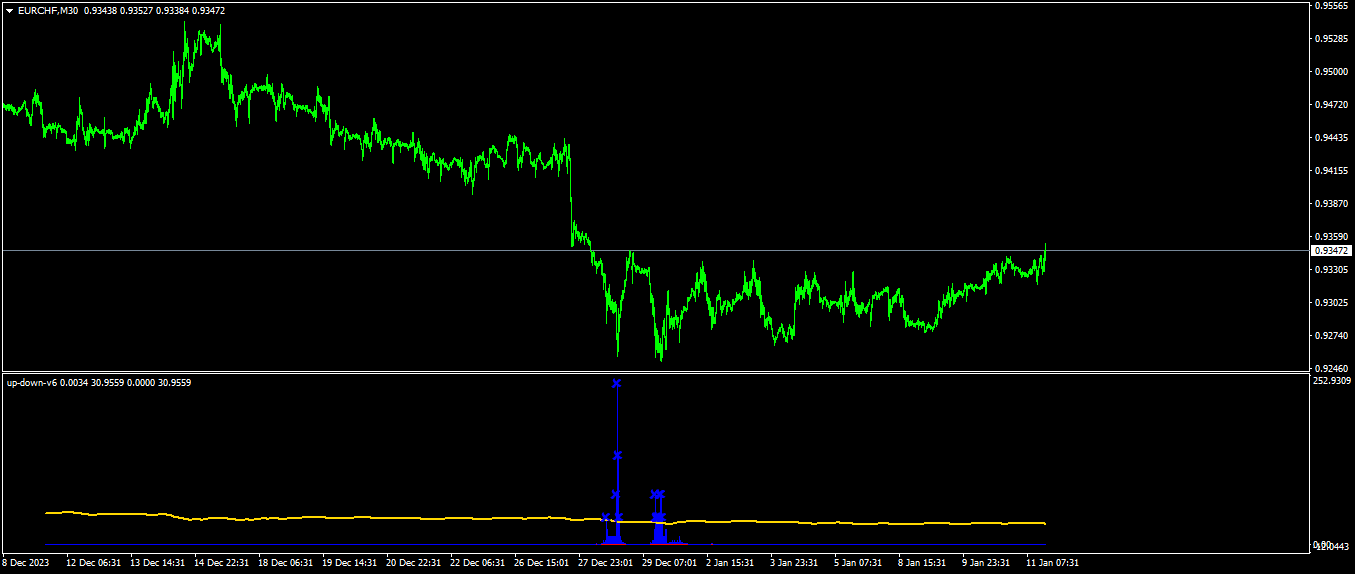
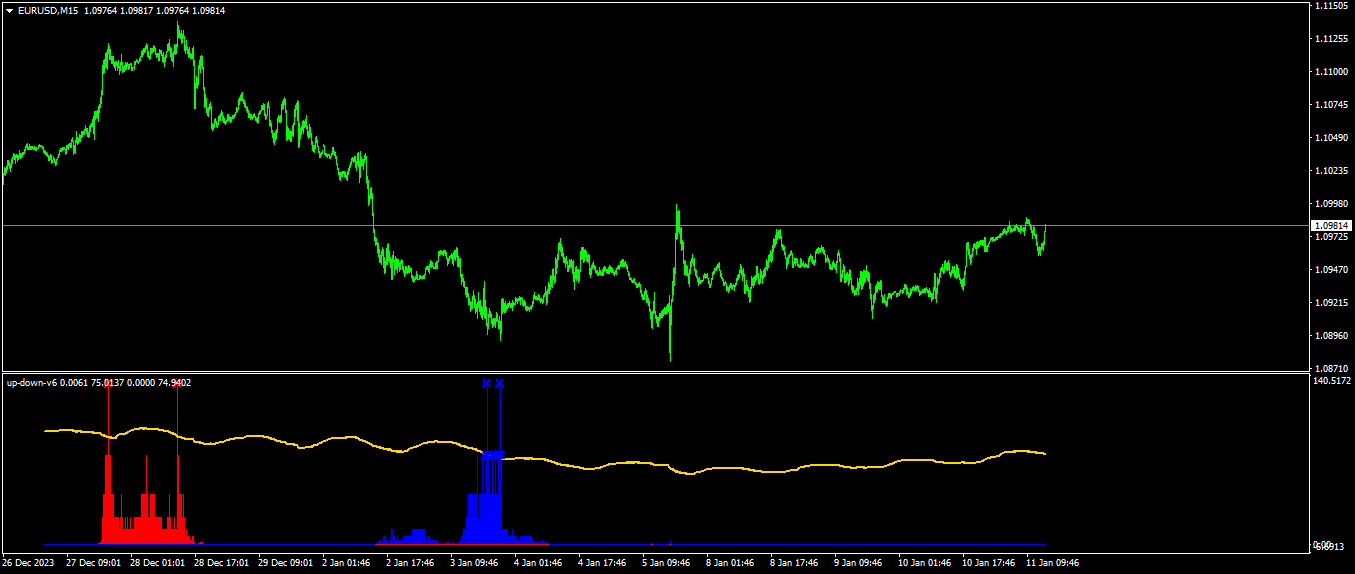
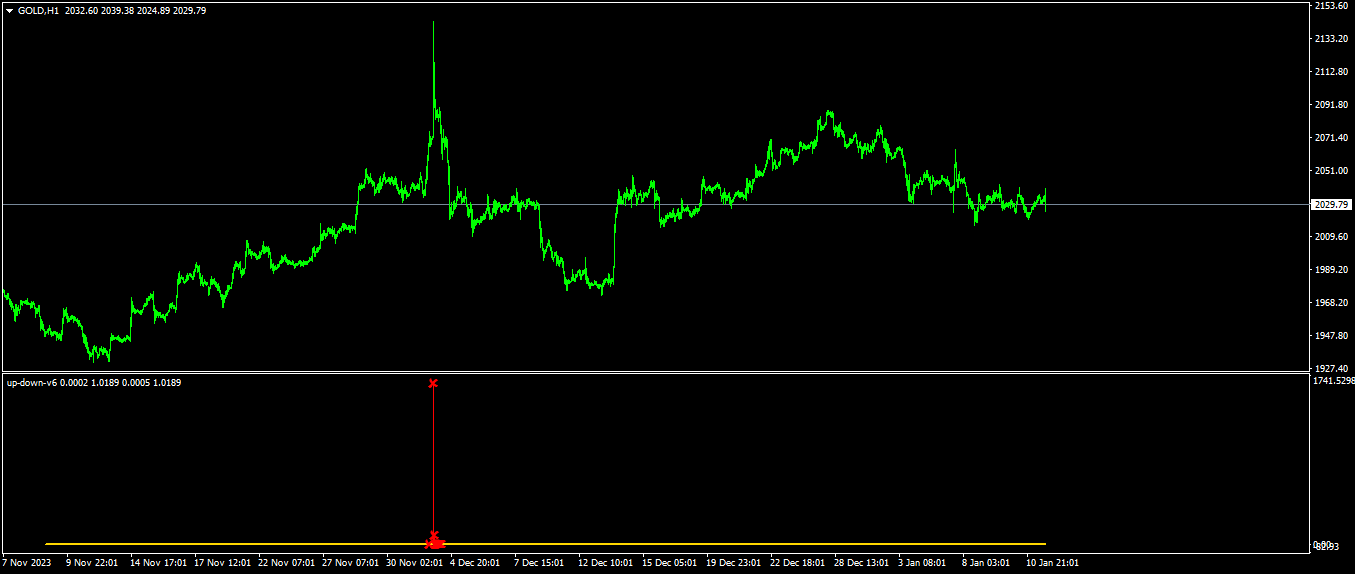
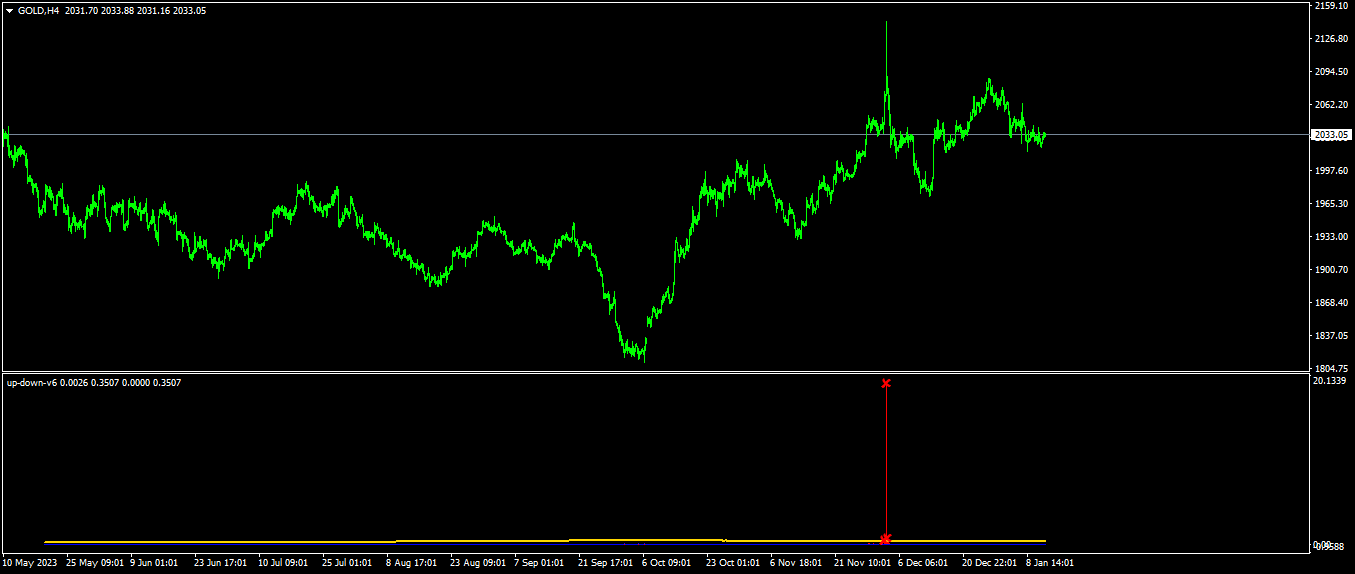
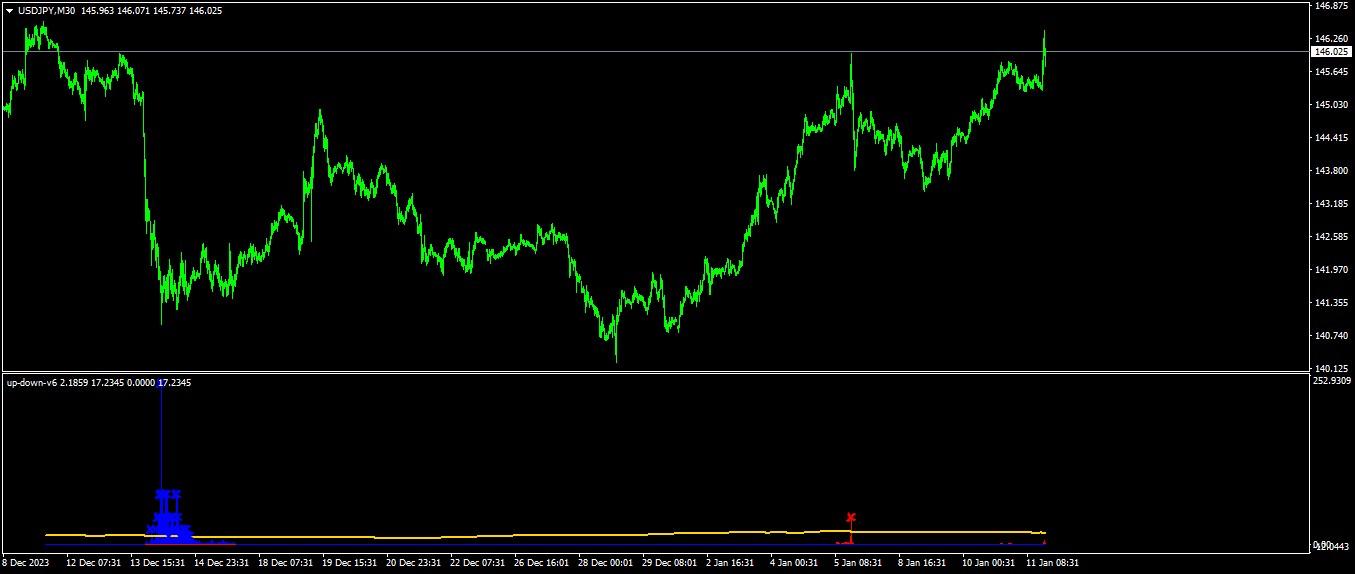
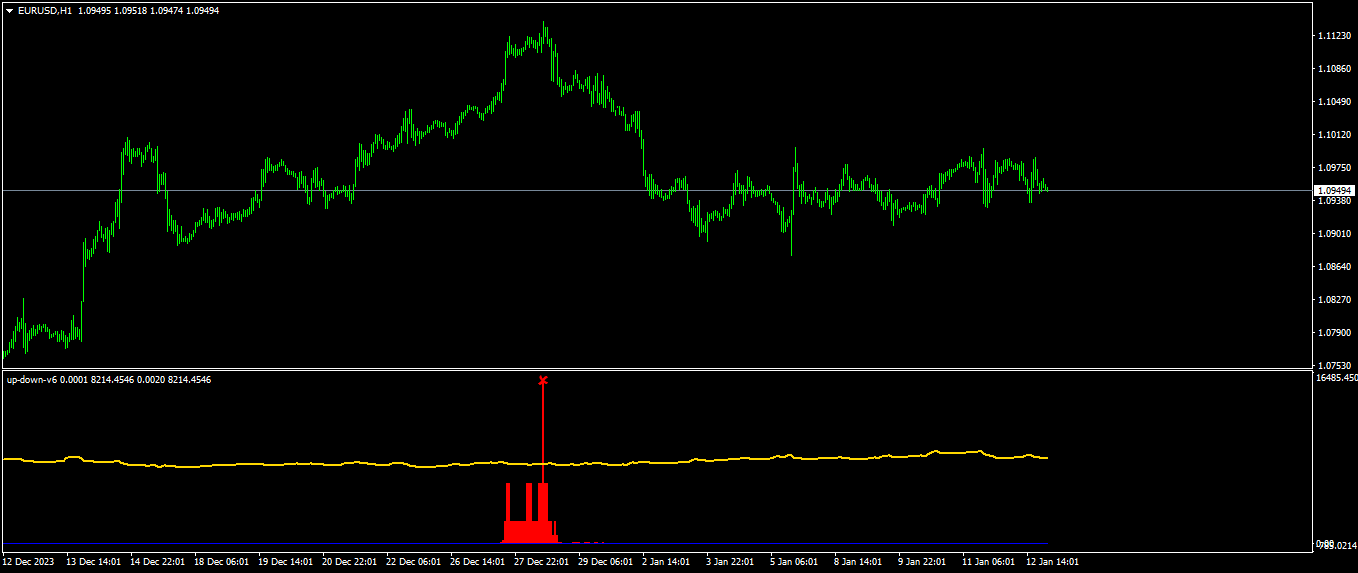
The Up-Down Trading Indicator generates signals based on the crossing of histograms. When the red histogram crosses the trigger line, it signals an uptrend, indicating that the price will likely move down. Conversely, when the blue histogram crosses the trigger line, it signals a downtrend, suggesting that the price will likely move up. This visual cue helps traders make informed decisions without second-guessing.
To view signals on a weekly chart, you might need to adjust the processing value due to lower data availability. Decreasing the processing value from 1000 to a minimum of 500 can help in this scenario.

Customizing the Indicator for Different Pairs and Periods
The Up-Down Trading Indicator includes a customizable parameter, the ‘C’ value. The default setting is 2.7, but you can adjust this to fine-tune the indicator according to different currency pairs and time frames.
Here’s a step-by-step guide to customizing the ‘C’ value:
- Set Initial ‘C’ Value: Begin with the default value of 2.7.
- Test on Daily or H4 Chart: Observe the up and down points on the daily or H4 chart.
- Adjust ‘C’ Value: Increase or decrease the ‘C’ value based on the observed signals until you find an optimal setting.
- Apply Consistently: Use this ‘C’ value consistently across all time frames for that specific currency pair.
Practical Application and Interpretation of Signals
Once you’ve set the optimal ‘C’ value for your chosen pair, the indicator will start providing signals across various periods. It’s essential to follow the signals as they appear on any period chart, whether it’s H4 or 15 minutes. The mathematical foundation of the Up-Down Trading Indicator aims to identify potential market turning points, offering a strategic advantage in trading.
Remember, while this indicator provides valuable insights, it does not guarantee success. Always consider other factors and use it as part of a broader trading strategy.
Avoiding Common Mistakes
Here are a few tips to avoid common mistakes when using the Up-Down Trading Indicator:
- Don’t Ignore Signals: Always act on the signals provided, regardless of the time frame.
- Regularly Adjust ‘C’ Value: Market conditions change, so periodically reassess and adjust the ‘C’ value.
- Combine with Other Tools: Use the indicator alongside other technical analysis tools for better accuracy.
- Monitor Processing Values: Especially on weekly charts, ensure your processing values are set appropriately to avoid missed signals.
Conclusion
The Up-Down Trading Indicator is a powerful tool for traders looking to predict market movements with greater accuracy. Its non-repainting feature, versatility, and adjustable settings make it a reliable choice for both novice and experienced traders. By understanding how to customize and interpret its signals, you can enhance your trading strategy and make more informed decisions.
In summary, remember these key points:
- The red histogram crossing the trigger line signals an uptrend (price will likely go down).
- The blue histogram crossing the trigger line signals a downtrend (price will likely go up).
- Adjust the ‘C’ value to suit different pairs and periods for optimal results.
Implement the Up-Down Trading Indicator in your trading routine and watch as it helps you navigate the complexities of the forex market with greater confidence. Happy trading!


