
Introduction to Bollinger Bands and RSI
Trading in the financial markets can be daunting, especially for beginners. However, combining the right tools and strategies can significantly enhance your trading performance. The Bollinger Bands and Relative Strength Index (RSI) trading strategy is one such powerful approach. This guide will walk you through the essentials of this strategy, helping you make informed decisions and boost your trading success.
Bollinger Bands and RSI are two widely respected technical indicators. When used together, they offer a robust method for analyzing market conditions and identifying trading opportunities. This strategy leverages the strengths of both indicators to provide clear entry and exit signals.
Key Features of Bollinger Bands and RSI Trading Strategy
- Simple Moving Average (SMA): The middle band of Bollinger Bands is typically set to 20 periods.
- Standard Deviations: Upper and lower bands are plotted two standard deviations away from the SMA.
- RSI Levels: RSI oscillates between 0 and 100, with key levels at 70 (overbought) and 30 (oversold).
- Time Frames: Works best on 15-minute, 30-minute, and 1-hour charts.
- Versatility: Applicable to various time frames and currency pairs.
- Risk Management: Incorporates stop-loss levels based on support and resistance.
Understanding Bollinger Bands
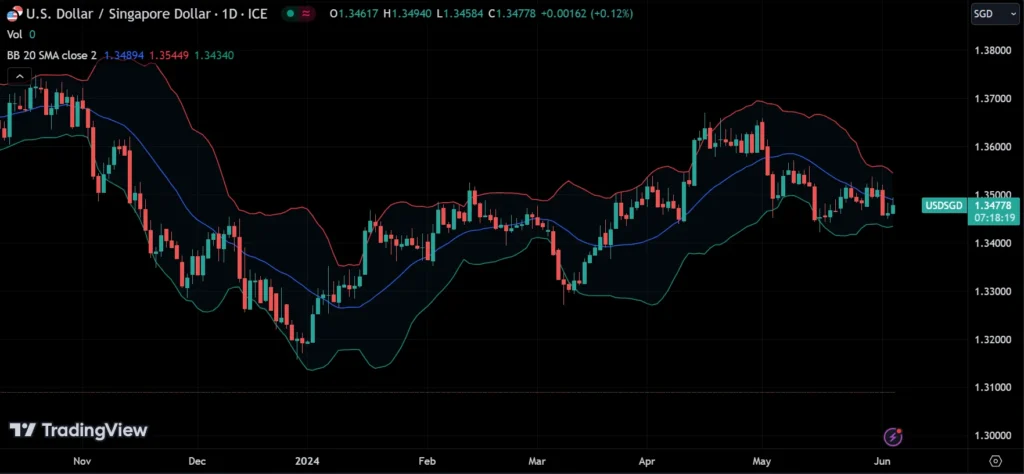
Bollinger Bands, developed by John Bollinger in the 1980s, are a type of statistical chart characterizing the prices and volatility of a financial instrument over time. Bollinger Bands consist of three lines:
- Middle Band: A simple moving average (SMA), usually set to 20 periods.
- Upper Band: Plotted two standard deviations above the middle band.
- Lower Band: Plotted two standard deviations below the middle band.
The distance between the upper and lower bands expands and contracts based on market volatility. During high volatility, the bands widen. Conversely, they contract during low volatility periods.

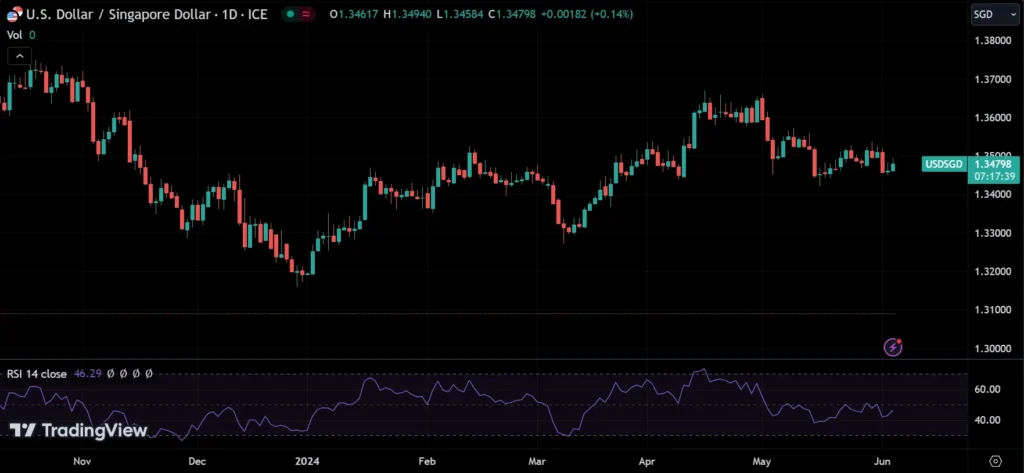
Understanding RSI
The Relative Strength Index (RSI), developed by J. Welles Wilder, is a momentum oscillator that measures the speed and change of price movements. The RSI oscillates between 0 and 100 and is used to identify overbought or oversold conditions.
Key RSI Levels
- 70 and above: The asset is considered overbought, indicating a potential sell opportunity.
- 30 and below: The asset is considered oversold, indicating a potential buy opportunity.
Bollinger Bands and RSI Trading Strategy
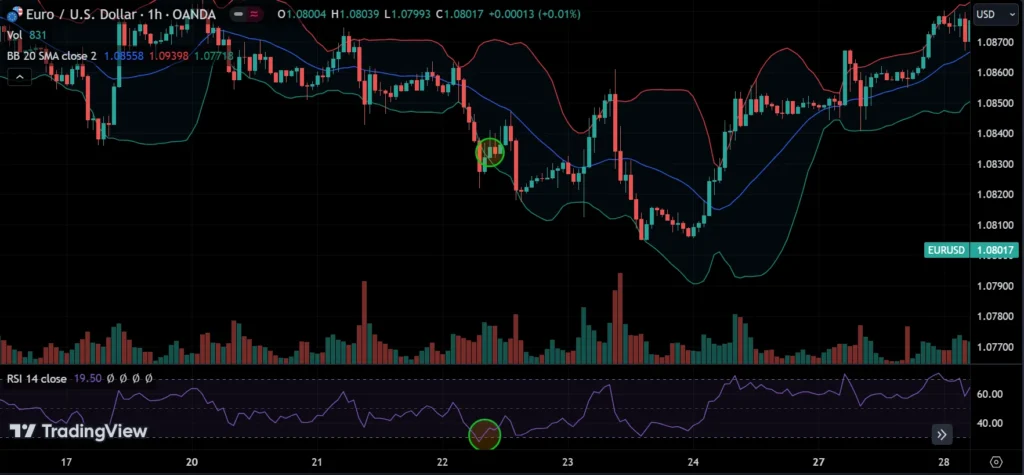
This trading strategy uses Bollinger Bands and RSI to capitalize on price changes during active market conditions. Typically, an RSI level of 70 indicates an overbought condition, while an RSI level of 30 indicates an oversold condition.
Entry Signals
- Buy Signal: When the RSI moves up from the oversold level (below 30) and the price is at or below the lower Bollinger Band, consider buying. Exit when the price reaches the middle Bollinger Band.
- Sell Signal: When the RSI moves down from the overbought level (above 70) and the price is at or above the upper Bollinger Band, consider selling. Exit when the price reaches the middle band.
Best Practices for Entry and Exit
- Only take positions when the RSI is between 70 and 30 to avoid getting caught in a prolonged trend.
- Use a 15-minute, 30-minute, or 1-hour chart for better accuracy.
- Test different currency pairs to find the ones that work best with this strategy. EUR/USD is a good starting point.
Trading Plan for Bollinger Bands and RSI Strategy
Creating a detailed trading plan is crucial for consistent success. Here’s a sample trading plan for this strategy:
Strategy Overview
- Trading Style: Day trading
- Strategy Type: Mean-reversion
- Holding Period: Few minutes to the end of the current session
- Asset Selection: Major Forex pairs
- Time Frame: 15-minute, 30-minute, 1-hour charts
- Entry Signal: RSI between 70 and 30 and price touching the upper or lower Bollinger Bands
- Take Profit Signal: Price reaching the middle Bollinger Band
- Position Sizing: Single entry with 2% risk per trade
- Stop Loss: 2% risk, near support/resistance, over 15 pips
Fine-Tuning Your Strategy
- Adjusting Standard Deviations: You can use 3 standard deviations for high-probability trades.
- Modifying RSI Levels: Customize the oversold and overbought levels based on your risk tolerance.
- Take Profit Variations: Experiment with different take profit points, such as just before the middle band or waiting until the price reaches the upper or lower bands.
Advantages of Bollinger Bands and RSI Trading Strategy
Ease of Use
This strategy is simple, making it accessible for both new and experienced traders.
Versatility
The strategy can be applied to various time frames and currency pairs, allowing traders to adapt it to their preferences.
Adjustable Parameters
You can modify the Bollinger Bands’ standard deviation and RSI levels to get more accurate signals based on your risk tolerance.
Effective in Various Markets
While particularly useful in range-bound markets, this strategy can also be applied to trending markets.
Limitations and Considerations
False Signals
RSI can generate false signals, especially during strong trending markets where the price continues to rise or fall despite overbought or oversold conditions.
Lagging Indicator
As a momentum oscillator, RSI can lag behind price movements, potentially causing delays in entry or exit points.
Volatile Markets
This strategy doesn’t work well during sudden market movements. Avoid trading on days with significant news events.
Missing Opportunities
Using a higher standard deviation for Bollinger Bands might lead to missing some good trading opportunities.
Disclaimer
The information provided in this article is for educational purposes only and should not be considered financial advice. Trading Forex involves significant risk and may not be suitable for all investors. Past performance is not indicative of future results. Always conduct your own research and consider your financial situation before making any trading decisions. Seek advice from a licensed financial advisor if needed.
Conclusion
The Bollinger Bands and RSI trading strategy is a powerful tool for traders seeking to capitalize on market volatility and momentum. By combining these two indicators, traders can identify potential entry and exit points with higher accuracy. However, like all trading strategies, it’s essential to incorporate proper risk management techniques and backtest the strategy under various market conditions before deploying it in a live trading environment. By doing so, traders can enhance their chances of success in Forex trading.


